
Interpreting Crime Data and Statistics in True Crime Research
Crime data and statistics describe or estimate patterns, frequency and change across a defined population, place and time; they do not independently prove what happened in an individual case. Use them as context only after matching the measure, data source, population or denominator, geographic scope and period to the research question, and use case-specific evidence for claims about a particular incident, person, motive or event sequence.
Crime-statistics interpretation map
Move from the research question to a bounded conclusion. Each step closes a different part of the statistic's meaning.
- Define the questionDecide whether you need event volume, population-relative frequency, a share or trend, or detail about one case.
- Match the measureUse a count for volume, a rate for frequency relative to a denominator, a proportion for a share of a defined total, and case data for an individual record.
- Match the sourcePolice-recorded data describe incidents entering the recording system; victimization surveys estimate experiences within their represented population and design; self-report studies depend on sampled respondents disclosing their own behaviour.
- Verify the statistical frameCheck the offence definition, population, geographic unit, time period and denominator, plus any collection, classification, missing-data or revision issues that affect comparability.
The sections below show how counts, rates, case records, source systems, comparability limits and historical continuity change what a crime statistic can legitimately support.
Table of Contents
What Crime Statistics Can Establish in True Crime Research
Crime statistics are most useful for aggregate context: what is recorded or estimated across a defined population, place or period. Their meaning changes when the measure, statistical frame or data-generating method changes.

Inference at a glance
Can establish or estimate
- Relative frequency within a defined base or context.
- A trend within a sufficiently comparable statistical series.
- A prevalence estimate for the population and method represented by the study.
- Differences between statistical patterns when the underlying measure and scope are sufficiently comparable.
Depends on
- The observed population and geographic unit.
- The period measured and the denominator where a rate is used.
- How observations were collected, classified and processed.
- Whether the compared series retain enough methodological compatibility.
Cannot establish by itself
- The truth of a case-specific allegation.
- A particular person's identity or motive.
- A causal mechanism or event sequence in an individual case.
Suppose the same recorded-crime measure shows a higher burglary rate in one city during one period than during an earlier comparable period.
That change can contextualize the broader pattern surrounding a case from that place and time, but it does not establish whether a burglary allegation in the individual case is true.
Case-specific conclusions still require case evidence.
Crime Counts, Rates and Case Data Measure Different Things
Crime counts, crime rates and case data answer different research questions because they use different units of observation, denominators and levels of detail.
A count represents event volume as a total number of incidents, while a rate relates that volume to a defined population or other appropriate denominator.
Case data instead describe an individual event or case record, preserving case-specific detail rather than expressing population-level frequency.

The comparison below separates the three measures by what is observed, whether a denominator is used, the research question each measure can support and its main limitation.
These dimensions clarify why the same underlying incidents can support different interpretations depending on how the data are expressed.
| Measure | Unit of observation | Denominator | Typical use | Main limitation |
|---|---|---|---|---|
| Crime count | Number of recorded or estimated events | None inherent to the count | Describing total event volume within a defined scope | Does not account for differences in population or exposure size |
| Crime rate | Events relative to a defined population or exposure base | Defined population or other relevant base | Comparing population-relative frequency across compatible groups or periods | Interpretation depends on the denominator, population definition, period and data construction |
| Case data | Individual incident or case record | No inherent population denominator | Examining case-specific circumstances, events or recorded details | Individual records do not by themselves describe population-level frequency |
As a hypothetical example, suppose two areas each record 100 incidents during the same period under the same offence definition, but one has a population of 10,000 and the other 100,000.
The count is identical, yet those illustrative values correspond to 10 incidents per 1,000 people in the first area and 1 per 1,000 in the second, so the rate changes the population-relative interpretation while the event volume remains the same.
A case record would answer a different question by describing one particular incident rather than the overall frequency.
Measure choice therefore depends on the research question and the available data, not on one measure being inherently preferable.
Crime Counts Describe Volume While Rates Standardize for Population
A crime count reports event volume as the total number of recorded or estimated incidents, while a crime rate expresses that count relative to a defined population or other appropriate denominator. The basic relationship is rate = count ÷ denominator × stated scale factor.
The count is the numerator and the denominator supplies the comparison base. A scale factor such as per 1,000 or per 100,000 changes how the same underlying ratio is expressed, so the scale must also match before headline rate values are compared directly.
A standardized rate supports comparison only when the offence definition, time period and denominator are sufficiently compatible for the intended interpretation.

For a hypothetical example, suppose two areas each record 80 incidents of the same offence during the same time period, with populations of 20,000 and 100,000 respectively.
Using resident population as the denominator, those illustrative counts equal 40 incidents per 10,000 people in the first area and 8 per 10,000 in the second, even though both areas have the same event volume.
The standardized rate therefore expresses different population-level frequency once population size is considered; it does not state what will happen to an individual.
The denominator must match the phenomenon being interpreted, because changing the population or exposure base changes what the resulting rate represents.
Case Records Describe Individual Events Rather Than Population-Level Patterns
Case records describe an individual event, such as a recorded incident, allegation, outcome or procedural event, while population statistics summarize observations across a broader group, area or period.
The unit of analysis therefore differs: case evidence concerns a particular record, whereas population-level statistics describe an aggregate pattern.
 This difference limits the inference that can be made from each form of information.
For example, a case record may document that a particular allegation was recorded and what procedural outcome followed, while an area-level statistic may summarize how often the same category of event appeared across many observations.
The case-level data can support conclusions about that individual record, whereas the aggregate statistics can support conclusions about the broader pattern within their defined scope.
Case records may contribute observations to an aggregate, but the resulting population-level pattern does not by itself establish a fact about any one case.
How Crime Statistics Are Collected and Produced
Crime-statistics production turns observed or reported events into published statistical values through a chain of collection, classification, validation, aggregation and publication decisions.
Reporting behavior and the source system affect which incidents enter the process, while coding rules determine how those observations are classified into statistical categories.
Completeness checks, estimation or adjustment where applicable, and later processing can further shape the values that appear in a published statistical series.
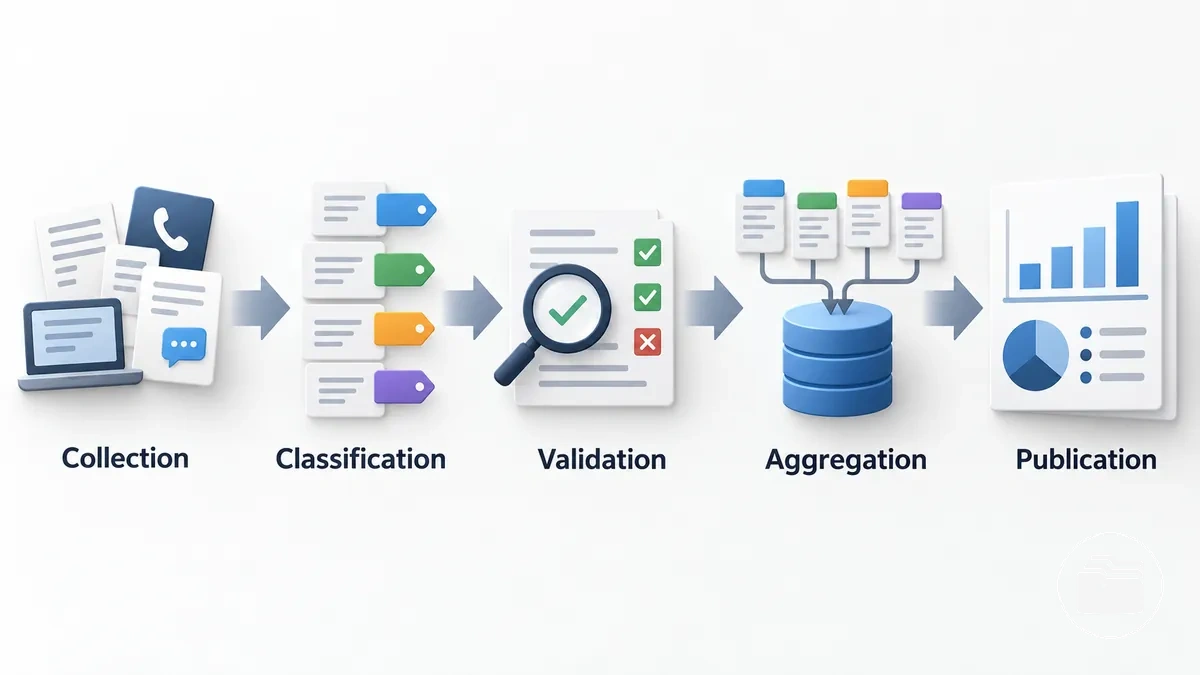
The sequence below represents the main processing stages that can connect observed incidents with a published statistical value.
Not every jurisdiction or data system uses every stage in the same way or in the same order.
- Collection: Information enters the source system through its relevant collection mechanism, influenced by which events are observed, reported or otherwise captured.
- Recording or intake: Submitted or observed information is entered into records according to the system's intake procedures and available fields.
- Classification and coding: Recorded information is assigned to categories using applicable definitions and coding rules, which determine how events are represented statistically.
- Validation and completeness checks: The data may be checked for consistency, missing information, duplication or other completeness issues before aggregation.
- Estimation or adjustment: Where the methodology requires it, statistical procedures may estimate, weight or adjust observations to address features of the source design or incomplete coverage.
- Aggregation: Individual observations are combined into totals, rates or other summary measures for defined populations, places or time periods.
- Publication and revision: The resulting statistics are released as a statistical series, and some systems may later revise published values when updated information or processing changes are incorporated.
The final published value therefore reflects both the observations available to the source system and the methodological rules used to process them.
Differences in jurisdiction, reporting behavior, definitions, coding rules, completeness procedures and estimation methods can produce statistical series that are not directly equivalent even when they use similar labels.
Publication does not make a value error-free, and revisions may occur when a system incorporates new information or changes its processing.
Interpretation should therefore remain tied to the specific source system and methodology that produced the statistic.
Police-Recorded Data, Victimization Surveys and Self-Report Studies Capture Different Parts of Crime
Police-recorded data, victimization surveys and self-report studies observe different portions of crime, so no single source captures the full universe of crime.
Police-recorded data depend on incidents reaching and being recorded by police, victimization surveys depend on sampling people and eliciting victim experiences, and self-report studies depend on respondents disclosing their own behaviour.
The comparison below distinguishes their source population, collection mechanism, strengths, blind spots and research implications.
| Source type | Source population | Collection mechanism | Strengths | Blind spots | Research implication |
|---|---|---|---|---|---|
| Police-recorded data | Incidents that enter police recording systems | Reporting, police detection or other intake followed by official recording practices | Describes recorded crime within the definitions and procedures of the police data system | Unreported crime and incidents that do not enter or remain in the recording system are not represented | Useful for questions about recorded offences and official statistical patterns, subject to reporting behaviour and recording rules |
| Victimization surveys | People or households represented by the survey sample | Sampled respondents report experiences of victimization through survey questions | Can capture victim experiences that were not reported to police and provide information about unreported crime within survey scope | Coverage depends on sampling, question scope, respondent recall and disclosure, and offences without an eligible or identifiable victim may fall outside the design | Useful for estimating victimization within the represented population when the survey design matches the research question |
| Self-report studies | Respondents included in the study sample | Participants disclose their own behaviours or offending through questionnaires or interviews | Can observe self-reported behaviour that may not appear in recorded crime data | Results depend on sampling and respondent disclosure, including willingness and ability to report behaviour accurately | Useful for studying reported behaviour within the sampled population when the disclosure method and sample fit the research question |
The three source types can complement one another because differences in reporting, sampling and disclosure mean that they may observe different parts of the same broader phenomenon.
Police-recorded data can describe recorded crime, while victimization surveys and self-report studies can provide evidence about experiences or behaviours that may not appear in police records.
Which source is suitable therefore depends on the offence, population, collection design and research question rather than on any one source being inherently more accurate.
Definitions, Classification and Counting Rules Shape the Results
The published value depends on the rules that decide what qualifies, how it is classified and how it is counted.
- Operational definition
- Sets which observations qualify for measurement.
- Offence classification
- Assigns qualifying observations to statistical categories through the applicable coding rules.
- Counting rule
- Determines how qualifying observations contribute to a statistical total.
- Recording threshold
- Can determine whether an event enters the recorded series at all.
For example, if a statistical system changes its operational definition so that a previously excluded class of incidents is coded within an existing offence classification, more observations may enter that category and increase its statistical total even when underlying offending has not increased by the same amount.
A changed counting rule or recording threshold can likewise alter how many recorded observations appear in the series without representing an equivalent change in real-world events.
The resulting trend must therefore be interpreted in light of both the measurement rules and possible changes in underlying offending.
An apparent increase or decrease may reflect a measurement change, a real-world change, or a combination of both.
Geographic Units, Time Periods and Denominators Change What Measures Mean
A statistical frame defines what a crime measure represents through its geographic unit, time period and denominator.
The geographic boundary determines the area included, the observation window determines when events are counted, and the population or other denominator determines the base against which a rate is interpreted.
These three attributes set the conditions for comparability between measures.
- Geographic unit: A measure defined for one jurisdiction or area reflects events within that boundary; changing the boundary can change which observations and population are included, so values from differently defined areas require qualification before comparison.
- Time period: A monthly observation window represents a different reporting period from an annual window; comparisons require compatible periods or an explicit adjustment because the amount of time represented differs.
- Denominator: A rate based on resident population can mean something different from one based on an exposure population or another population base; changing the denominator changes the relationship expressed by the measure and therefore its interpretation.
For example, suppose a geographic boundary is redrawn so that an additional populated area enters the statistical unit while the offence definition and observation window remain unchanged.
The resulting value may differ because both the observations and population inside the frame have changed, so comparison with the earlier boundary is not automatically like-for-like.
Comparability therefore depends on keeping geographic unit, time period and denominator sufficiently compatible or explicitly qualifying the differences.
How to Interpret Crime Statistics for Case Research
Disciplined interpretation of crime statistics starts by matching the research question to a measure, source and statistical frame that can actually address it.
The relevant population, period and geographic scope must be explicit before a statistical pattern is used as context for case research.
The goal is a bounded conclusion that reflects what the data support without extending the inference beyond the measure's scope or limitations.
The ordered method below moves from the research question to a qualified interpretation of the available statistical context.
Each step includes a verification cue to test whether the evidence remains aligned with the question being asked.
- Define the research question: State precisely what needs to be known and verify whether the question concerns a population-level pattern, a comparison or a case-specific proposition.
- Select the relevant measure: Identify the count, rate, prevalence estimate or other measure that addresses the question, and verify that its meaning matches the intended inference.
- Identify the source and construction: Inspect how the statistic was collected, classified, coded and aggregated, and verify which observations the source can include or miss.
- Verify the statistical frame: Check the population, period, geographic scope and denominator where applicable, and verify that they correspond to the context being interpreted.
- Check comparability and limitations: Assess whether definitions, methods and frames are sufficiently compatible for the intended comparison, and identify any limitation that requires qualification.
- State a bounded conclusion: Express only the statistical pattern supported by the evidence and verify that the conclusion does not imply causation or a case-specific fact that the data cannot establish.
For example, a dataset showing that a recorded offence was more frequent in one defined area during one period than in another comparable period can support the narrow conclusion that the recorded statistical pattern differed between those periods.
The same dataset does not by itself establish why the change occurred or whether a particular case followed that broader pattern.
Case evidence would be required to support a conclusion about an individual event.
A bounded conclusion should therefore state what the statistic shows, the frame in which it applies and the inference that remains unsupported.
Match the Statistical Measure to the Research Question
Statistical measure selection depends on the exact research question because different measures represent different attributes of crime data.
A count represents event volume, a rate represents frequency relative to a defined denominator, a proportion represents a part of a defined total, and a case-level observation preserves detail about an individual event.
The criteria below match common information needs to a suitable measure and the main condition that governs its interpretation.
- Event volume → count: A count fits a question about how many events were recorded or estimated within a defined scope; the period, geographic scope and event definition must correspond to the intended total.
- Population-normalized frequency → rate: A rate fits a question about event frequency relative to a population or other denominator; the denominator must represent an appropriate population base for the intended comparison.
- Distribution or share → proportion: A proportion fits a question about what fraction of a defined total belongs to a category; both the subset and the total used as the denominator must be clearly specified.
- Trend → consistent statistical measure: A trend question requires the same relevant measure to be assessed across periods under sufficiently compatible definitions and measurement conditions so that observed change has a consistent meaning.
- Case-specific detail → case-level observation: A case-level observation fits a question about attributes of an individual event or record; its detail supports case-level interpretation rather than population-level frequency.
For example, if the research question asks whether recorded offence frequency differs relative to population between two areas, a raw count answers the question poorly because it shows event volume without accounting for population size.
A rate addresses that question more directly by relating events to a defined population denominator, provided the denominator, period, geographic scope and offence definition are sufficiently compatible.
Measure choice is therefore decision-relevant when the selected measure represents the attribute the research question actually asks about and its interpretive condition is satisfied.
Compare Data Only When Definitions, Places and Periods Are Compatible
Data comparability requires sufficiently compatible definitions, collection methods, geographic units, time periods and denominators before numerical differences can support a like-for-like interpretation.
Similar values alone do not establish methodological compatibility because a mismatch in any of these conditions can change what the figures represent.
The following checks identify whether a comparison is supportable or requires qualification.
- Definition: Check whether the same offence definition, classification and coding basis apply to both series; if they differ, the values may represent different sets of events and the comparison requires qualification or may be unsuitable.
- Collection method: Verify that the observations were collected through sufficiently compatible methods; a methodological mismatch can change which events enter each dataset and weaken the interpretation of a numerical difference.
- Geographic unit: Confirm that the compared areas use compatible boundaries and jurisdictional scope; different geographic units can include different populations or events, preventing an unqualified place-to-place comparison.
- Time period: Check that the reporting windows cover compatible periods and durations; comparing different time periods can confound the numerical difference with differences in timing or exposure length.
- Denominator: Verify that rates use compatible population bases or other denominators; a denominator mismatch changes the frequency relationship expressed by each rate and can make the headline values non-equivalent.
For example, suppose two otherwise similar crime series use geographic boundaries that place an additional area inside one statistical unit but outside the other.
Even if their reported values appear close, the comparison is not fully like-for-like because the geographic unit and population represented by each series differ.
The result should therefore be explicitly qualified or the comparison abandoned when the mismatch prevents a defensible interpretation.
Treat Statistical Patterns as Context Rather Than Case Proof
Statistical patterns and case evidence operate at different levels of inference, so they should not be treated as interchangeable.
Aggregate statistical context
Describes association, frequency or change across a defined population, area or period. It can support a bounded statement about the group or setting.
Case-specific evidence
Directly bears on a proposition about an individual incident or person. It is required for claims about identity, motive, causation, an allegation's truth or a particular event sequence.
Suppose data show that a recorded offence is more frequent in one area during a defined period than in a comparable area or period.
A defensible statement is that the case occurred within a context where the recorded aggregate pattern was more frequent.
It would be an overextended inference to use that statistical context alone to assign a particular motive, identity or cause to the individual case.
The permissible conclusion should therefore remain within the evidence scope: use the aggregate pattern for context and rely on case-specific documentation for claims about the individual case.
Limitations That Affect Accuracy and Comparability
Crime-statistics limitations such as incompleteness, measurement error, reporting behavior and methodological constraints can reduce confidence in a conclusion without automatically invalidating the underlying data.
Their effect depends on the source, offence, period and statistical system, including how events are reported, recorded, estimated and revised.
Interpretation should therefore reflect both the limitation present and whether it affects accuracy, comparability or the scope of the conclusion.
The table links common limitations to the mechanism through which they affect recorded statistics and to the resulting interpretive response.
It focuses on under-reporting, recording differences, missing data, estimation, revision and incompatible definitions without assuming that each limitation has the same effect in every dataset.
| Limitation | Mechanism | Likely effect | Interpretive response |
|---|---|---|---|
| Under-reporting | Reporting behavior determines whether some experienced or observed events enter a recorded-crime system. | Recorded totals can be incomplete relative to the events within the intended phenomenon, with the degree of incompleteness depending on reporting patterns. | Treat the statistic as a measure of recorded crime within that reporting process and qualify conclusions that require fuller event coverage. |
| Recording differences | Differences in coding, classification or recording practice can introduce measurement error by changing how similar observations are represented. | Apparent differences between datasets can partly reflect methodology rather than differences in the underlying events. | Check whether recording practices are sufficiently compatible before interpreting a numerical difference as substantive. |
| Missing periods or observations | Missing data create gaps in the observations available for a defined period or series. | Totals, rates or trends may represent incomplete coverage and provide weaker evidence for comparisons spanning the missing period. | Identify the gap explicitly and narrow or qualify the conclusion to the observations that are actually available. |
| Estimation | Statistical procedures may estimate unobserved or incompletely observed values using assumptions defined by the source methodology. | The published value can contain additional uncertainty because part of it is inferred rather than directly observed. | Distinguish estimated values from directly observed values and keep confidence proportional to the documented estimation method and coverage. |
| Revision | Later information or processing changes can alter previously published values. | Different releases of the same series may contain different values, affecting continuity and comparisons made from earlier versions. | Use a consistent release where possible and identify the revision status when differences between versions affect the interpretation. |
| Incompatible definitions | Different offence definitions, category boundaries or inclusion rules can cause similarly labelled statistics to represent different phenomena. | Numerical similarity does not establish comparability when the underlying categories are not like-for-like. | Restrict comparison to sufficiently compatible definitions or state a qualification explaining why the figures should not be interpreted as equivalent. |
The severity of a limitation determines how narrowly the resulting inference should be framed rather than whether the data must be accepted or rejected as a whole.
A minor constraint may require a specific qualification, while missing coverage or incompatible definitions can substantially weaken confidence in a broader comparison.
Conclusions should therefore be no stronger than the accuracy, coverage and comparability supported by the particular dataset and conditions being examined.
Under-Reporting and Recording Practices Affect Recorded Crime
Recorded crime is the end of a measurement sequence, not a complete census of all victimization. Events can be lost or represented differently at more than one stage.
- Experienced or observed crime: the broader phenomenon includes events that may never be reported to police or another recording authority.
- Reported crime: reporting behaviour determines which experienced events reach the recording system, creating under-reporting when events are not reported.
- Recorded crime: information that reaches the authority is represented through the applicable recording practice, classification and administrative rules, which determine whether and how an incident enters the official count.
The size and direction of these gaps can differ across offence types, populations and jurisdictions because reporting behavior, recording practice and administrative rules do not operate uniformly in every context.
A lower reporting propensity for one offence type can leave a larger share of experienced crime outside the recorded dataset, while differences in recording or administrative treatment can alter the relationship between reported incidents and the final official count.
Interpretation should therefore treat recorded crime as evidence about incidents captured by the relevant reporting and recording system, with under-reporting and recording processes considered when relating that dataset to underlying incidence.
Missing Data, Estimates and Revisions Affect the Strength of Conclusions
Data status changes how strongly a statistical series can support a conclusion because missing observations, estimated values and revisions represent different evidence conditions.
Missing data
Reduces completeness and can interrupt continuity, limiting conclusions that depend on the missing period or observations.
Estimated value
Introduces uncertainty linked to the estimation, imputation or adjustment method because part of the value is inferred rather than directly observed.
Revision
Changes a previously published value or series. A revision may improve precision or coverage, but mixing releases can change comparability with earlier conclusions.
Conclusion strength should therefore reflect the amount of available data, the adjustment method and the revision state: stronger confidence is more defensible when relevant observations have sufficient completeness, while substantial gaps or uncertain estimates may require a tentative conclusion or make a particular inference unsuitable.
For example, if one period in a series is identified as estimated rather than observed, a trend statement spanning that period should acknowledge the estimate instead of presenting every point as having the same evidentiary status.
If that period is later revised using additional information, the revised series may support a different interpretation without implying that revision itself weakened the data.
Where revisions affect a conclusion, the version history should be checked so the published values being compared come from the intended release.
How to Use Historical Crime Statistics Across Time
Historical crime statistics should be interpreted as a time series only when methodological continuity is sufficiently stable or changes are explicitly reconciled.
A long-term trend can reflect numerical change, but its meaning also depends on whether the definition, collection system, geographic coverage and population base remain comparable across the period.
Historical values are therefore interpretable in relation to the measurement rules and population that produced them rather than as uniformly comparable figures throughout the series.
The following continuity checks establish whether a historical series has a stable or explicitly reconciled measurement frame.
Each condition affects whether observed change can support a long-term comparison or requires qualification.
- Definition continuity: Check whether the offence definition, classification and inclusion rules remain sufficiently consistent; a changed definition can alter which events enter the time series and create an apparent change that is partly methodological.
- Collection-system continuity: Verify whether the collection system and core recording methodology remain stable; a system change can alter how observations are captured and weaken comparison across the transition.
- Geographic coverage: Confirm whether the same jurisdictions, boundaries or reporting areas remain within scope; changed geographic coverage can add or remove populations and events from the historical series.
- Population base: Check whether rates use a compatible population base or denominator across the period; a changed population base can alter the frequency represented even when the recorded event count follows a different pattern.
- Revision status: Determine whether values come from compatible releases of the series; later revisions can change previously published observations and affect comparisons that mix different revision states.
- Documented series breaks: Identify any series break caused by a known methodological or jurisdictional change; values on opposite sides of the break should be qualified or treated as separate segments unless the source provides a basis for reconciliation.
For example, suppose a historical series shows an increase across a period in which the collection system changes and the source identifies a series break.
The figures can describe the values published before and after that change, but the numerical difference alone does not establish a single long-term trend because part of the change may reflect the altered measurement frame.
The comparison should therefore identify the break and limit the claim to periods with sufficient methodological continuity or explicitly qualify the cross-break interpretation.
This keeps the historical conclusion tied to the definition, population and system that produced each part of the series.
Account for Changes in Law, Definitions and Collection Methods
A methodological regime change can create a series break when a law change, offence definition, classification rule or collection method alters what the statistical measure includes or how events are recorded.
A numerical shift between pre-change and post-change periods can therefore reflect a change in measurement, a change in underlying offending, or both.
Interpretation should treat the applicable methodological regime as a condition attached to each period rather than assume one continuous definition across time.
For an illustrative example, suppose a classification rule is broadened so that incidents previously excluded from an offence category are included after the change.
The post-change measure may then contain a wider set of recorded events than the pre-change measure even if underlying offending does not change by the same amount.
Comparing the two periods without qualification could therefore overstate how much of the numerical difference represents real-world change.
The changed classification rule, affected measure and resulting series break should be disclosed whenever they limit pre-change and post-change comparability.
Account for Population and Geographic Boundary Changes
Population growth, migration and boundary change can alter the geographic frame of historical crime statistics by changing the population represented, the numerator, the denominator or more than one of these components.
A jurisdiction that keeps the same name may nevertheless cover a different area after annexation, boundary redrawing or another jurisdiction change, while its population base can also change independently through demographic movement.
Comparability therefore depends on identifying which part of the statistical frame changed rather than assuming that the same place label represents the same population and coverage over time.
Prefer Comparable Statistical Series When Tracing Long-Term Change
Comparable statistical series support a more defensible interpretation of long-term change than a longer collection of figures whose definition, method, coverage or denominator changes without reconciliation.
Historical length alone does not establish continuity because differences in measurement can be mistaken for changes in crime.
The following verification checklist tests whether a series retains enough continuity in its measurement frame to support a long-term trend claim.
- Source continuity: Check whether the series comes from the same source system or from sources with explicitly reconciled methods; a source change without reconciliation can make observed differences partly attributable to measurement change.
- Offence-definition continuity: Verify that a consistent definition and relevant classification basis apply across the compared periods; a changed offence definition can alter which events enter the series and weaken interpretation of the numerical change.
- Geographic coverage: Confirm that the areas or jurisdictions represented remain sufficiently consistent; changed coverage can add or remove populations and recorded events, limiting like-for-like comparison.
- Denominator: Check that rates use a compatible population base or other denominator throughout the comparison; a changed denominator alters the frequency relationship expressed by the series.
- Reporting period: Verify that each observation represents a compatible reporting period and duration; inconsistent periods can make apparent changes reflect different measurement windows rather than comparable long-term change.
- Documented breaks and revisions: Identify every documented break or material revision affecting the series; values across such points require qualification or explicit reconciliation before they can support a continuous trend interpretation.
For example, a longer historical series may contain changes in definitions or collection methods, while a shorter series may preserve a consistent definition, method, coverage, denominator and reporting period throughout.
For a long-term trend claim confined to that shorter period, the methodologically comparable series permits a more direct interpretation even though it contains fewer years.
The longer series can still be used when the relevant discontinuities are identified and the claim is qualified to reflect them.
If incompatible datasets must be combined, their differences require explicit reconciliation rather than being spliced into a seamless trend.